High-frequency analysis with greentech
Cooperation between morEnergy and greentech — greentech uses ONIS devices to open a new business line to provide the best service in market to their clients
About the
high frequency analysis
“New high-frequency analysis measures currents, voltages and resonances up to 150 kHz”
When components of a PV system fail, this may be due to harmonic distortions in the electrical internal or external grid. They can have a massive impact on the connected devices, restrict functions and thus accelerate wear or ageing processes of the components. This leads to recurring repair costs due to failures and defects, of which the exact causes are often unknown.
High transparency of the network topology
By an high sampling rate, our analysis determines impedances even in the high-frequency range up to 150 kHz. In contrast to common standard power quality measurements, this provides completely new and much more detailed insights into the nature and quality of the electrical network – and the resulting challenges for the plant.
Derive and implement measures for trouble-free and long-term plant operation
From the results of the measurements, indications of defective components will be derived. They can be replaced in the next step being designed according to the existing grid conditions. For new systems, for example, recommendations for the filter design of inverters can be derived and implemented before major damage occurs. In addition, it is possible to find out whether sources of interference outside the PV system have a negative influence on the operation of the system.
Services
PQ-Check
Get to the bottom of frequent failures or recurring defects in the system:
- Uncovers causes for frequent / recurring failures of certain system components indicates increased stress on certain components
- Enables effective protective and precautionary measures
- Reduces repair costs and yield losses
Electrical Fingerprint

Focus on plant health right from the start and ensure the basis for a long and efficient service life:
- Reduces wear and stress on new equipment right from the start
- Enables longer maintenance intervals / reduces costs
- Provides transparency on the condition of the system after completion of construction and at recurring intervals
- Provides an objective asset valuation (e. g. in case of sale)
Area of application
Information on the procedure:
- Detection of currents, voltages and impedances in the high-frequency range
- Measuring points usually on the low-voltage side of the transformer station.
- Scope depends on the number of transformer stations and the inverter design as well as the respective system type and the installed components Data acquisition and transmission with the Online Network Impedance Spectrometer ‘ONIS’
- Analysing the data and evaluating the measurement results.
- Preparation of a comprehensive report including consideration and evaluation of the normative specifications for the low-frequency range. In addition: Definition and adjustment of further limit values in the high-frequency range
- Evaluation of the anomalies according to relevance in the form of a traffic light system with corresponding recommendations for action
Example
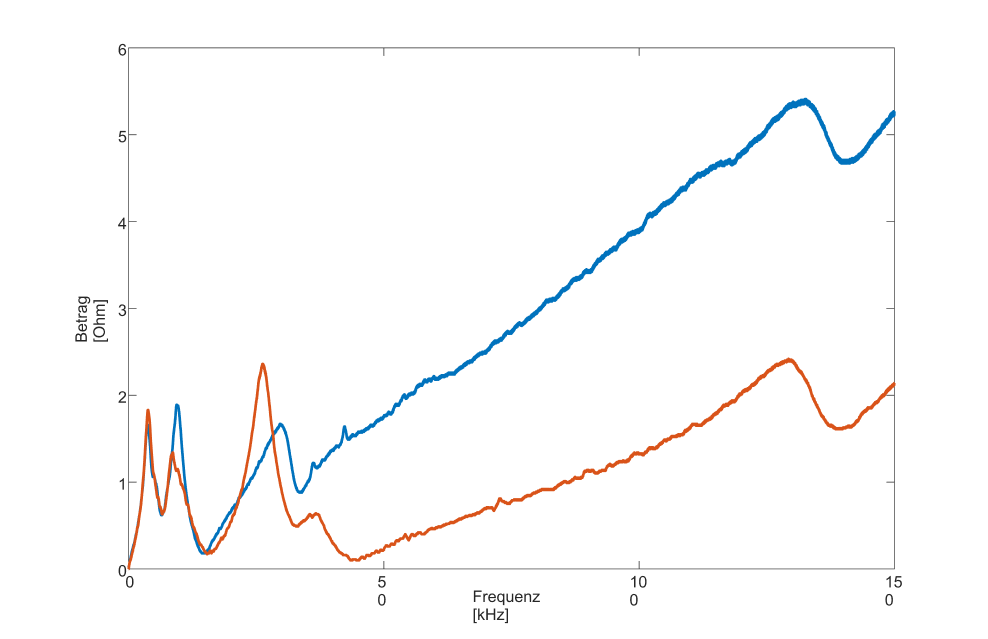
Measurements with significant target-actual deviations (target value: red / actual value: blue)
Deviating behaviour from the nominal condition: From 27 kHz steadily increasing impedances, from 37 kHz too high impedances
Consequence: the plant fed 20 % less power into the grid. Loss of revenue over 6 months more than 100.000 €
Cost
from EUR 2.950, —
Dies ist ein Richtpreis, der die Analyse für Anlagen zwischen 1 und 3 MW mit 4 Messstellen beinhaltet. Die Reisekosten werden zusätzlich berechnet. Da wir wissen, dass jede Anlage anders ist, erarbeiten wir für Sie ein individuelles Messkonzept, das sowohl den Anlagentyp als auch die installierten Komponenten und bereits bekannte Probleme berücksichtigt.
Haben Sie noch Fragen? Bitte kontaktieren Sie uns!